Inside the LLM — Interactive LLM Inference Visualization
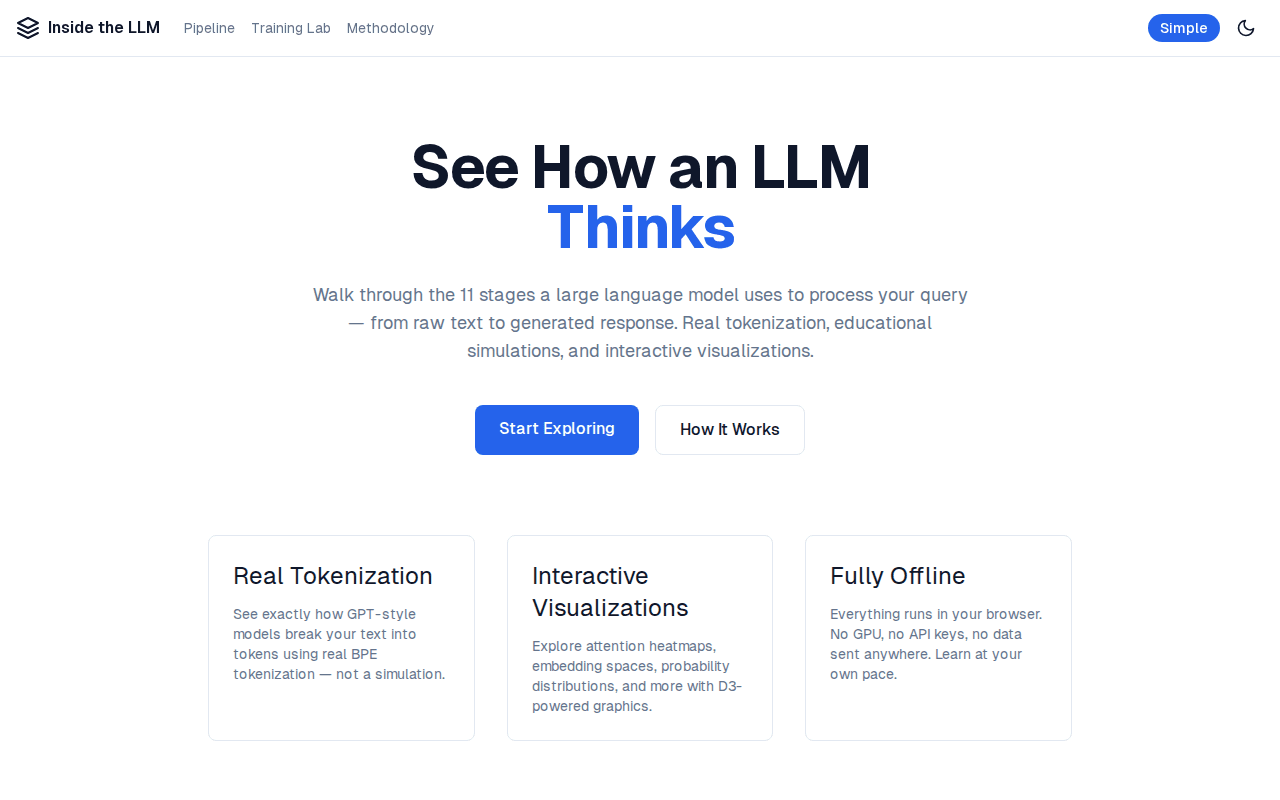
The landing page introducing the 11-stage inference visualization
LLMs are a black box to most people — including the engineers and executives making decisions about them. This tool turns the inference process into something you can see and interact with, stage by stage.
Inside the LLM is an educational tool designed to demystify how large language models actually work. Instead of treating inference as a black box, it breaks the process into 11 interactive stages that users can explore at their own pace.
Starting with tokenization (using the real GPT tokenizer), users can see how text becomes tokens, how those tokens are embedded into high-dimensional vectors, and how positional encoding gives the model a sense of order. The attention mechanism is visualized with interactive D3 heatmaps that show which tokens attend to which.
The project is honest about what is simulated and what is real computation. It runs entirely in the browser with zero API calls, but the architecture uses a provider pattern that would allow swapping in real model backends without any UI changes. Both beginner and technical explanation modes are available for each stage.
Key Features
11-Stage Inference Pipeline
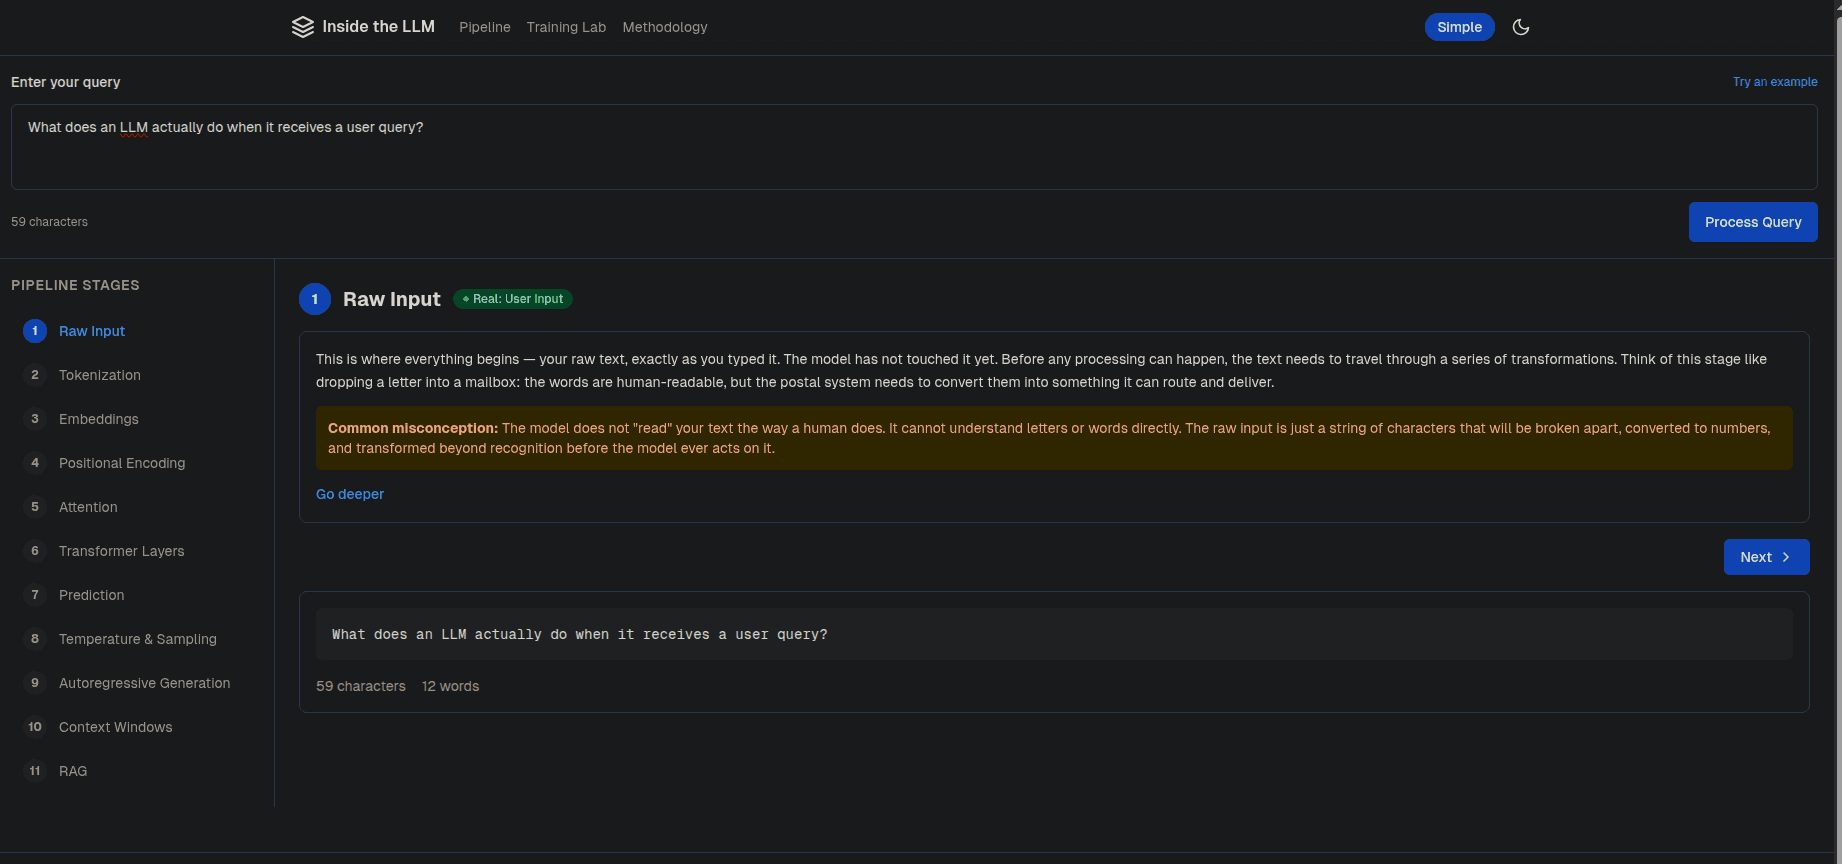
Users enter a query and walk through every stage from Raw Input to RAG. Each stage is labeled as real or simulated computation, with beginner-friendly explanations, common misconceptions, and a "Go deeper" toggle for technical detail.
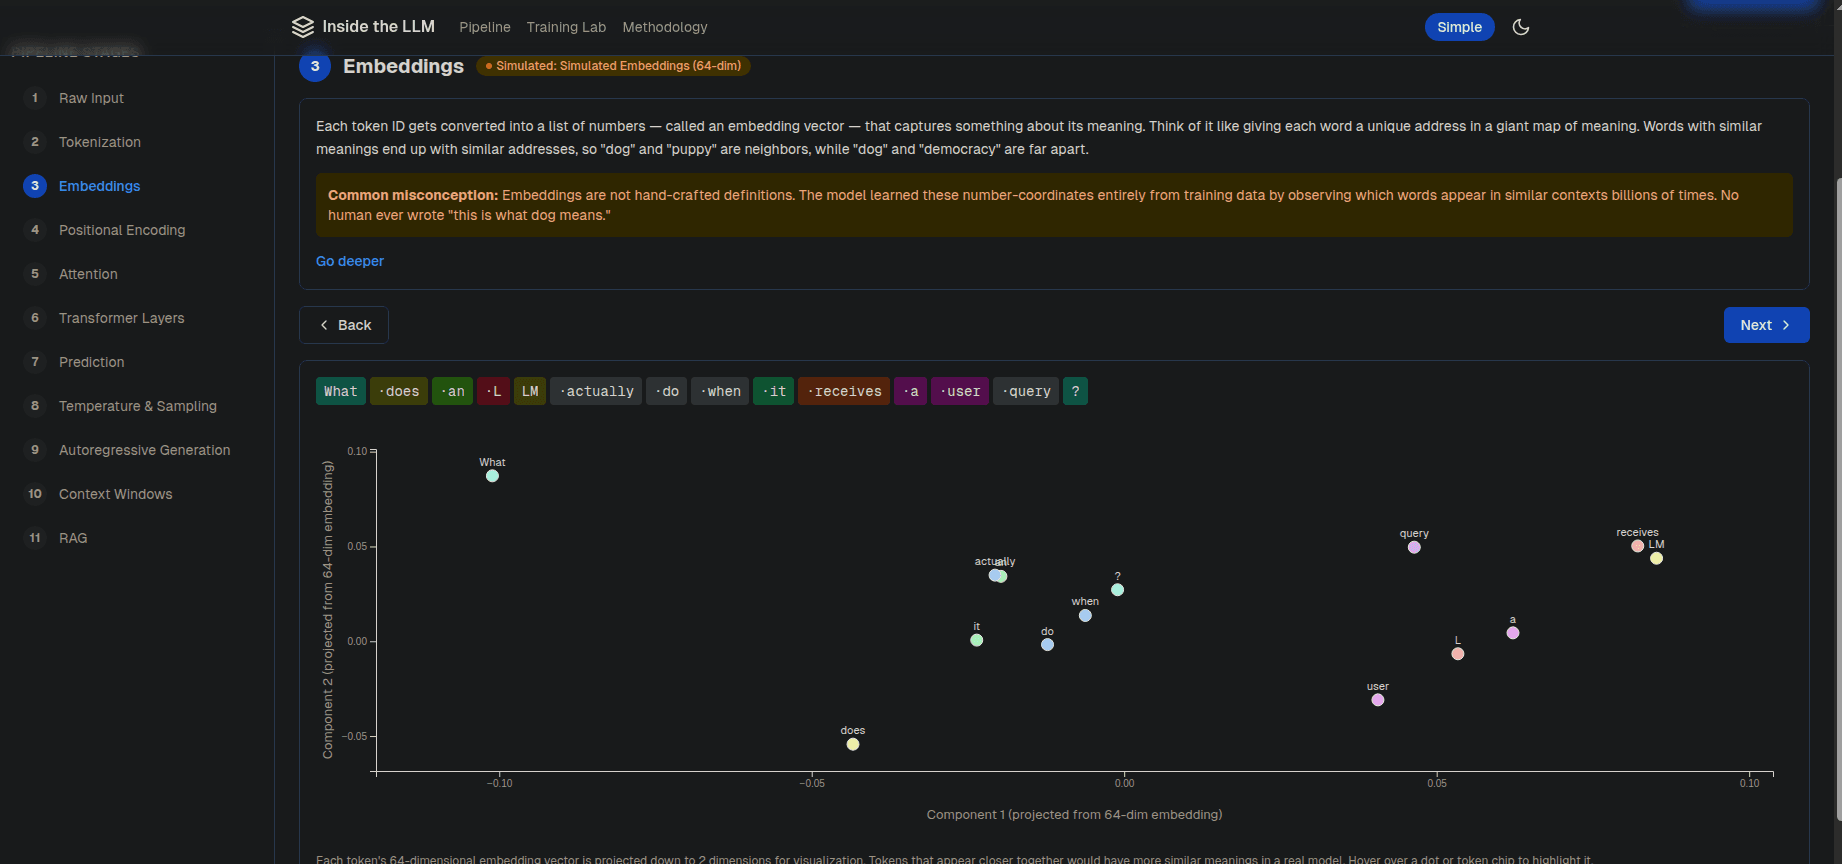
Embedding Scatterplot
Tokens are converted into 64-dimensional embedding vectors and projected onto an interactive D3 scatterplot. Hover over any token chip or dot to see how semantically similar tokens cluster together in vector space.
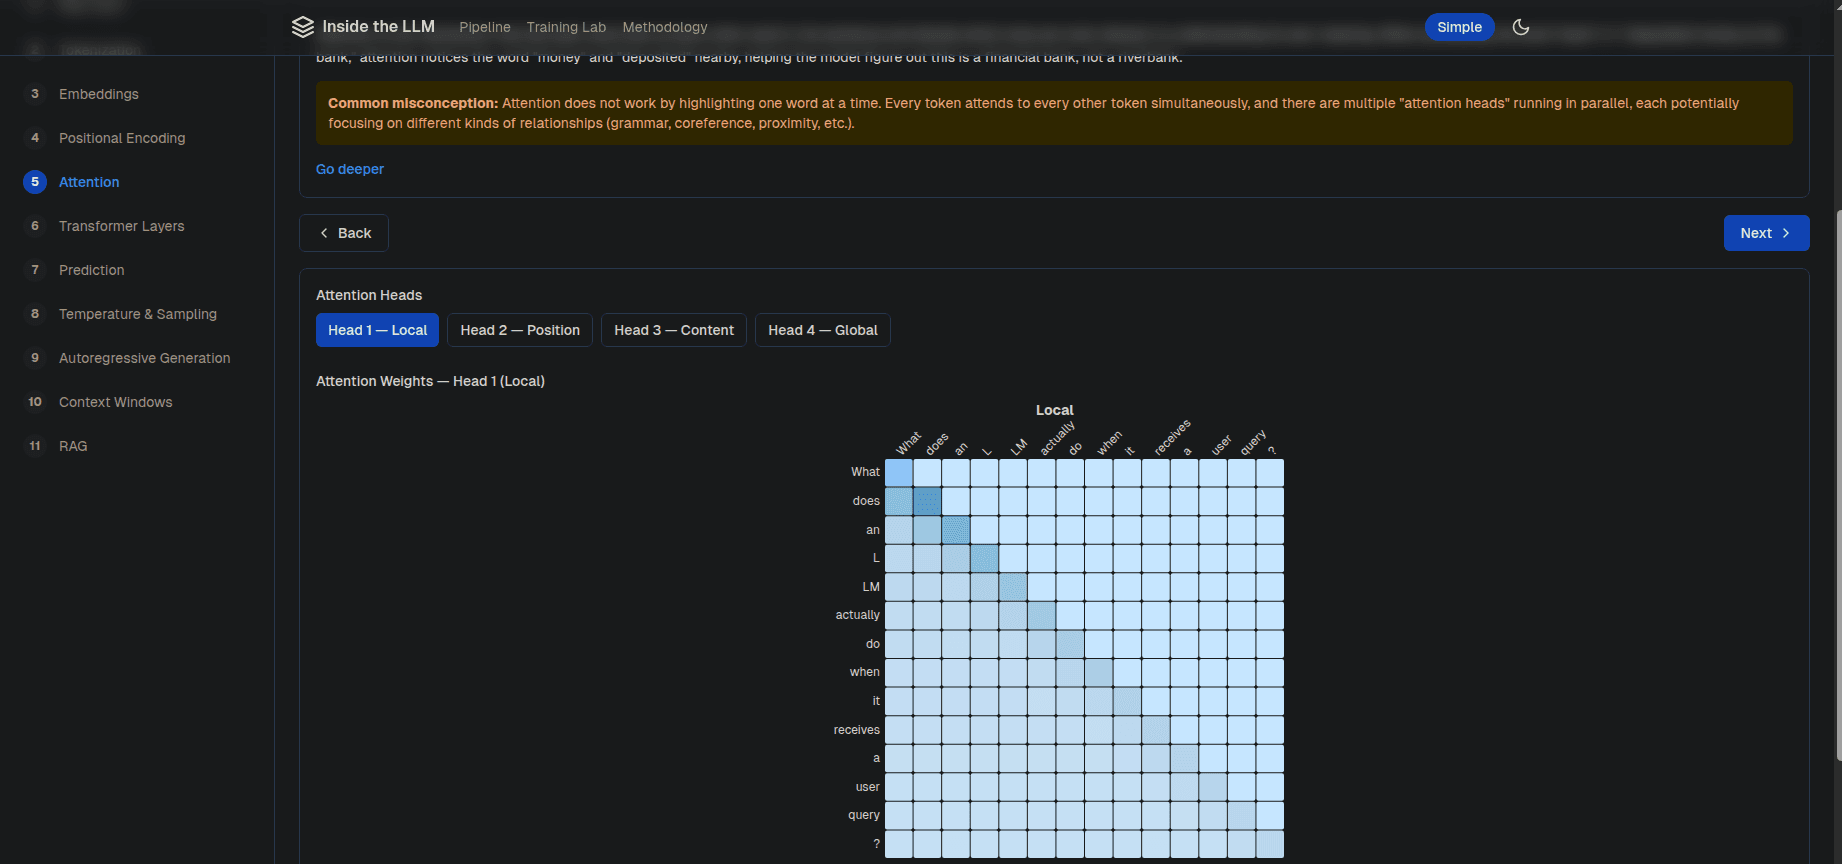
Attention Heatmap
An interactive attention weights heatmap visualizes how every token attends to every other token. Four attention heads — Local, Position, Content, and Global — can be toggled to show different relationship patterns the model learns.
Temperature & Sampling Controls
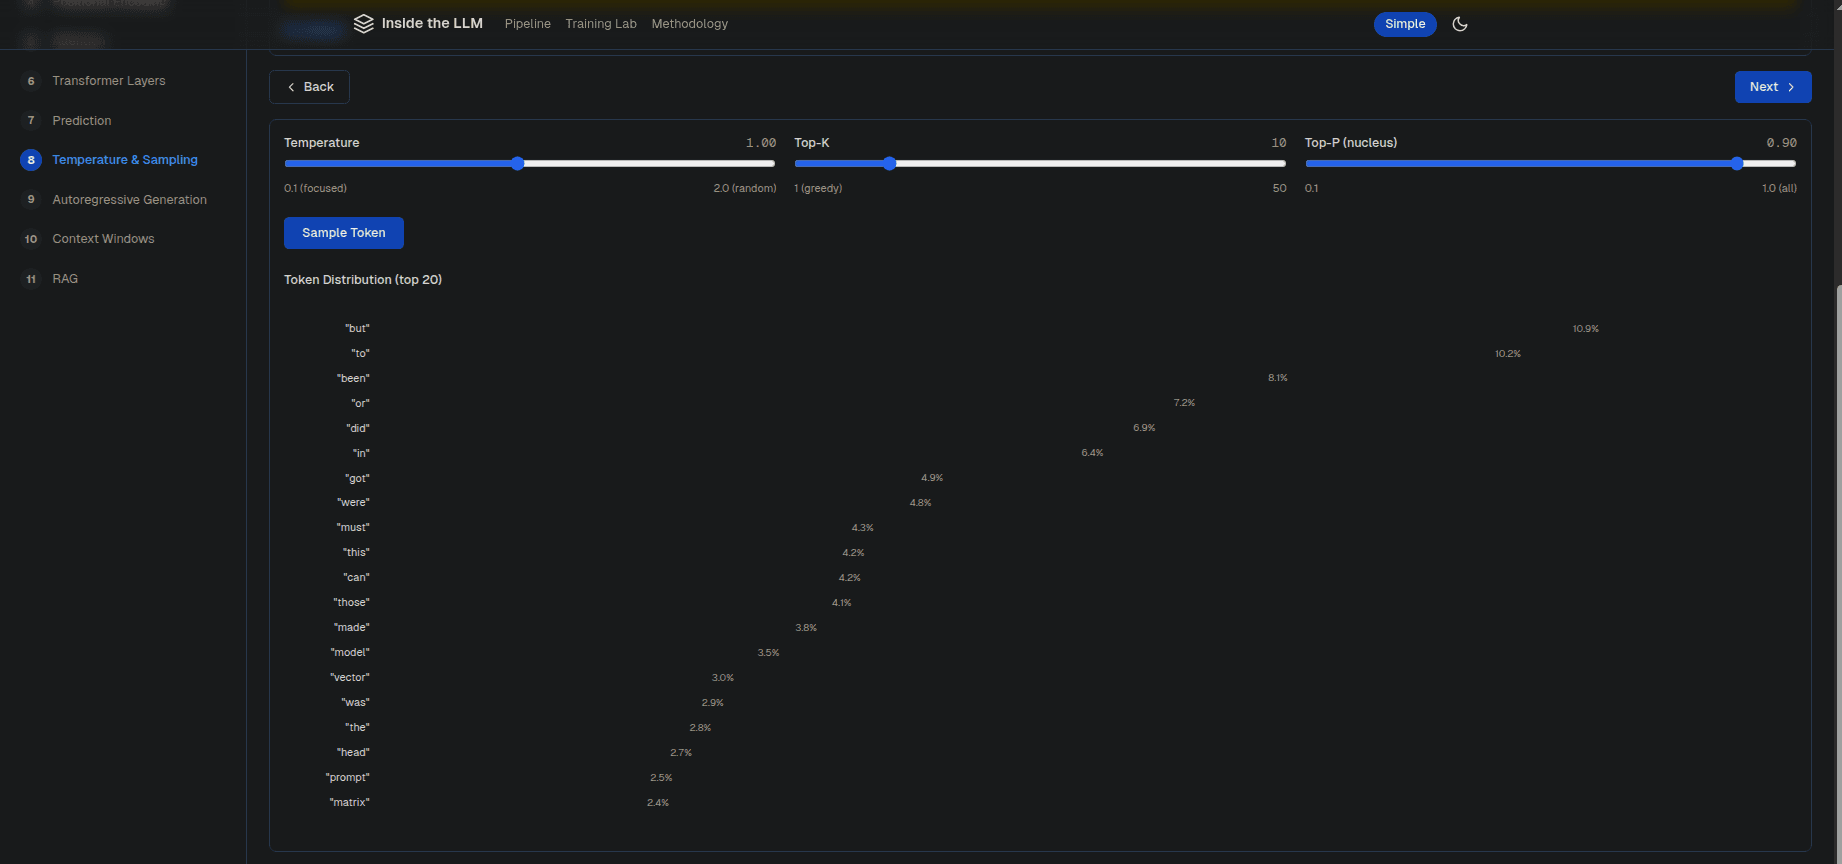
Interactive sliders for Temperature, Top-K, and Top-P (nucleus) let users sample tokens and see how each parameter reshapes the probability distribution across the top 20 candidate tokens in real time.
Beginner & Technical Modes
Every stage offers two explanation levels — beginner-friendly overviews and detailed technical breakdowns — so the tool serves both curious newcomers and ML practitioners.
Fully Client-Side
The entire application runs in the browser with no API calls. Real GPT tokenization is performed locally, and the provider pattern allows plugging in real model backends.
Screenshots